Implementing resilient applications with API Gateway (Health Check)
API Health Check
API Health Check 🩺
We know that API services fail due to any number of reasons, such as networks issues, connection (failed to open a connection to a data source like a SQL Server database) and API performance issues, failure to authenticate to dependencies, outage of a shared dependency, crash because of critical bugs, memory leaks and many more😬. In such scenarios, our services should be resilient enough to deal with predictable failures when they happen before they become more significant headaches🤯 than they need to be. Dealing with single server failures is more effortless, as the number of applications grows, you face new challenges in monitoring the health of each microservice to understand how your microservices-based application behaves when any of them becomes unavailable.
As a part of API monitoring the best practices, health check❤️ allows immediate-real-time information about the state of your APIs, containers, and microservices. An API health check is able to check anything that may interrupt the API from serving incoming requests😎.
For example, when you are using orchestrators like Kubernetes and Service Fabric periodically perform health checks and determine that a service/container is unhealthy, it stops routing requests to that instance. It also usually creates a new instance of that container.

API Health Check with an API Gateway
The simplest and standardized way to validate the status of a service is to define a new health check endpoint like /health or /status as a separate REST service implemented within a microservice component. ASP.NET Core offers Health Checks Middleware and libraries for reporting the health of app components.
👉🏼 Health checks are exposed by a microservice as HTTP/HTTPS endpoints.
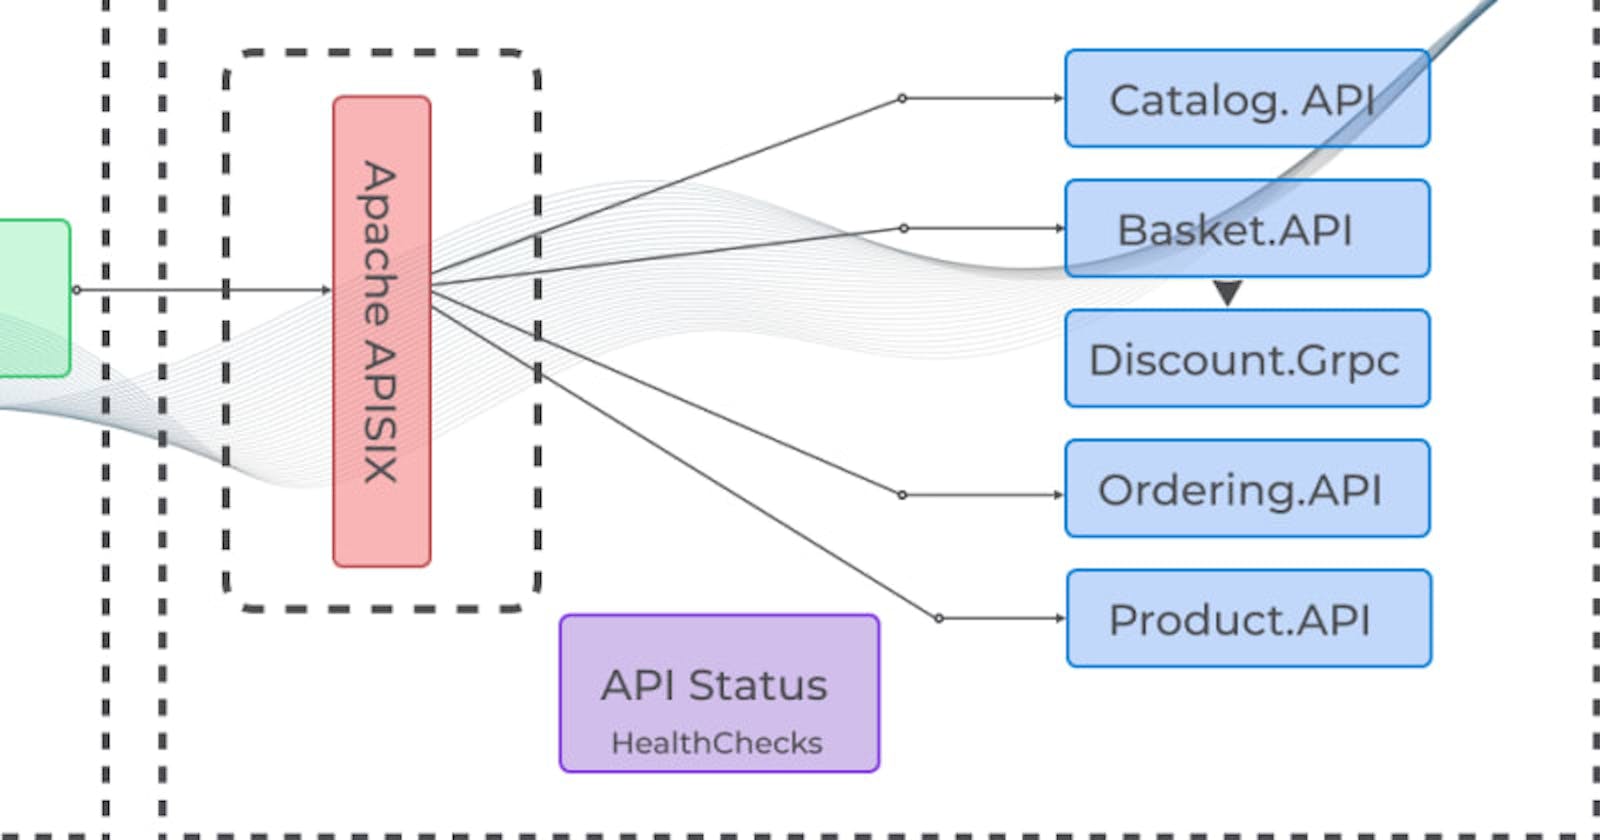
Then enable a health check managing functionality at the API Gateway level. API Gateway acts as an orchestrator that can use this status report to decide how to manage the traffic, load balance to a healthy node, fail-fast due to some cascading failures or simply alerts you when it notices something goes wrong. API Gateway also ensures that routing and other network-level components work together successfully to deliver a request to the API process. It helps you to detect in the early stage and fix issues for your running application much more easily.
Apache APISIX Upstream Health Check
Apache APISIX API Gateway supports almost all modern resiliency patterns like the timeouts, fallbacks, retry, and circuit breaker I discussed in another blog post Implementing resilient applications with API Gateway (Circuit breaker), which can also be applied to your Microservices APIs. Apache APISIX Health check mechanism performs health checks on each target upstream service regularly, marking it as healthy or unhealthy based on whether they are responsive or not. You can also retrieve anytime the health status of specific nodes by using the Control API-health check endpoint.
Active and Passive Health Checks
APISIX provides two types of health checks:
➕ Active checks - APISIX periodically requests a health check API endpoint exposed by a target (backend service) to identify if an upstream service is available to serve the request.
➖Passive checks, APISIX acts as a proxy for operations that might fail. The proxy monitors the number of recent failures that have occurred and uses this information to decide whether to allow the operation to proceed, or simply return an exception directly. The passive health check is also known as a Circuit breaker.
How Upstream Active Health Check works❓
💁In this blog post, we are focusing on mainly the active health check and how to use it, I covered the passive health check approach in more depth here by using of API Breaker Plugin.
You can enable and manage the active health check through the upstream configuration where health check configuration settings are defined. To enable active health checks for the upstream, you need to specify the configuration items such as counters, statuses or interval (how often API health status is determined in seconds), and here a short breakdown of different scenarios that might happen:
🟢 If the upstream returns a healthy HTTP status code, it will increment the upstream.checks.active.healthy.successescounter for the target node. If the success counter reaches the limit specified in the configuration, then the upstream node will be marked as healthy.
🔴 If it fails to connect, it will increment the upstream.checks.active.unhealthy.http_failures counter for the target node. If this counter reaches the limit specified in the configuration, then the upstream node will be marked as unhealthy respectively.
There are other properties like timeouts, and tcp_failures, you can discover more about them in the documentation.
Apache APISIX Upstream Health Check demo
🙋🏼 Once we have the little background on how Apache APISIX handles health checking for its upstream services, let's jump into the demo of implementing the health check orchestration mechanism for our existing sample project ASP.NET Core WEB API with a single GET endpoint (retrieves all products list).
Prerequisites
☝️ If you followed the previous blog post about Manage .NET Microservices APIs with Apache APISIX API Gateway, make sure you have read it and completed steps (To run APISIX, etcd, and ASP.NET WEB API) before continuing with a demo session.
Register health check feature in the backend
To begin, we need to use the HealthChecks feature in our back-end Product ASP.NET microservice. With the help of built-in APIs in .NET, we can configure the health check service easily.
The following example creates a health check endpoint at /api/health path. We need to just add this code to Configure method in Startup.cs file
app.UseHealthChecks("/api/health");
Next, we need to add simple logic to generate random health statuses each time you request the endpoint gives different result by indicating the health as Healthy, Degraded, or Unhealthy. Of course, you can add your custom logic to define the health status properly.
services.AddHealthChecks()
    .AddCheck("random-health-status", () =>
    {
        Random rnd = new();
        for (int j = 0; j < 100; j++)
        {
           var rndNum = rnd.Next();
            if (rndNum % 2 == 0)
            {
                return HealthCheckResult.Unhealthy();
            }
            else {
                return HealthCheckResult.Healthy();
            }
        }
        return HealthCheckResult.Degraded();
    });
With the above changes, now we added the health check functionality to our API. If you use curl cmd to make an HTTP request to the health check endpoint or navigate to the following URL on your browser, you will see the health endpoint is responding.

To make the example close to reality, you can also add one more instance of Product microservice. Simply, define another service in docker-compose.yaml file running in different ports like below:
...
  productapi1:
    image: productapi
    build:
      context: ./productapi
      dockerfile: Dockerfile
    ports:
      - "5555:80"
    networks:
      apisix:
  productapi2:
    image: productapi
    build:
      context: ./productapi
      dockerfile: Dockerfile
    ports:
      - "5556:80"
    networks:
      apisix:
...
Create an Upstream with Health Check configuration
To use the health check feature effectively and automate monitoring in the API Gateway, you need to first create a new Upstream, configure its properties and define a new Route with the upstream health check capability.
The following upstream configuration example monitors the health check of two nodes productapi1 and productapi2 by triggering every 2 seconds /api/health endpoint of each, if any of them is not available(unhealthy), it forwards the requests to a healthy node or report service unavailable error:
curl "http://127.0.0.1:9080/apisix/admin/upstreams/1" -H "X-API-KEY: edd1c9f034335f136f87ad84b625c8f1" -X PUT -d '
{
 "nodes": {
     "productapi1:80": 1,
     "productapi2:80": 1
 },
 "type": "roundrobin",
 "checks": {
     "active": {
         "type": "http",
         "http_path": "/api/health",
         "healthy": {
             "interval": 2,
             "successes": 1
         },
         "unhealthy": {
             "interval": 1,
             "http_failures": 2
         }
     }
   }
}'
☝️ You can use the upstream.checks.active.type field to specify whether to perform HTTP or HTTPS probes.
Create a Route for the upstream
Next, we will configure new route so that APISIX can forward the request to the corresponding upstream service we created in the previous step:
curl http://127.0.0.1:9080/apisix/admin/routes/1 -H 'X-API-KEY: edd1c9f034335f136f87ad84b625c8f1' -X PUT -d '
{
    "name": "Route for health check",
    "methods": ["GET"],
    "uri": "/api/products",
    "plugins": {},
    "upstream_id": "1"
}'
Note that we can also achieve the same configuration results above with the CLI as with the Apache APISIX Dashboard. You can learn more about the usage of the dashboard in the Getting started with Apache APISIX Dashboard video tutorial.
How to validate Health Check🙎
We can easily test how Apache APISIX monitors health checks of targets by stopping productapi1 or productapi1 container from docker 🤪 which causes the 503 Service Temporarily Unavailable error and when one target is unhealthy, you can see the requests are forwarded to another healthy node. The following curl cmd to simply trigger the /api/product endpoint:
curl http://localhost:9080/api/products -i
If you look closer into the logs of both productapi service instances, you can also notice the endpoint receives from APISIX many times requests to check health status.
apisix-dotnet-docker-productapi1-1       | fail: Microsoft.Extensions.Diagnostics.HealthChecks.DefaultHealthCheckService[103]
apisix-dotnet-docker-productapi1-1       |       Health check random-health-status with status Unhealthy completed after 0.0081ms with message '(null)'
What's next ➡️
In this blog post, we learned the usage of Apache APISIX API Gateway to enable health monitoring for microservices APIs. There are many aspects of using API health check endpoints for API load balancing, reporting metrics, and testing APIs dependencies, such as databases and external service endpoints, to confirm availability. APISIX can be also the central point for all types ( logging, monitoring, and tracing) of API Observability and further derive useful data into other monitoring, analytics, and visualization solutions like Prometheus, Grafana, or Elasticsearch. Learn more about API Observability with Apache APISIX Plugins.
Related resources
➔ Implementing resilient applications with API Gateway (Circuit breaker).
➔ Manage .NET Microservices APIs with Apache APISIX API Gateway.
➔ API Gateway Caching for ASP.NET Core WEB API
Recommended content 💁
➔ Watch Video Tutorial Getting Started with Apache APISIX.
➔ Watch Video Tutorial Manage .NET Microservice API with Apache APISIX API Gateway.
➔ Read the blog post Overview of Apache APISIX API Gateway Plugins.
➔ Read the blog post Run Apache APISIX on Microsoft Azure Container Instance.
➔ Read the blog post API Security with OIDC by using Apache APISIX and Microsoft Azure AD.
➔ Read the blog post API Observability with Apache APISIX Plugins.
Community⤵️
🙋 Join the Apache APISIX Community 🐦 Follow us on Twitter 📝 Find us on Slack 📧 Mail to us with your questions.
